1. One of the main features of the world population today is the considerable increase in the absolute and relative numbers of older people. Yet, the meaning of age has changed. No longer are ‘middle age’ or ‘old age’ thought of as separate phases of life;ageing is now seen as a continuum.
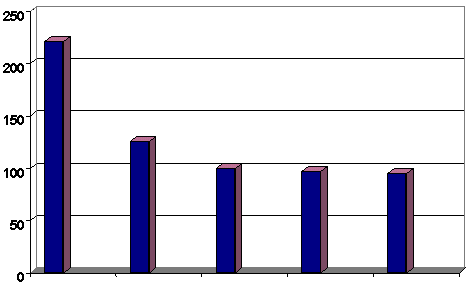
2. The proportion of older people is rising. By 2020, it is estimated that the world’s population will consist of more than 1,000 million people aged 60 years and older. The older population is ageing also; the ‘oldest old,’ those over 75 years old, are the fastest growing group. The number of people world-wide who will reach 100 years or more is expected to exceed 2 million by 2050.
Age Structure for Developed Regions
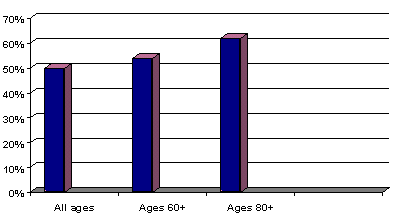
3. Fifty-five percent of the total world population consists of women (United Nations 2000). This percentage is set to steadily increase over the next two decades.
Women’s Share of World Population at Specified Ages, 2025
Source: Gist YV and Velkoff VA. (1997) Gender and Aging: Demographic Dimensions. US Census Bureau International Programs Centre
Women in the European Union, 1996
| Country | Total pop (000) | Number of Women | Women as % | ||||||||||||||||
| EU | 372 653 590 | 190 739 240 | 51.18 | ||||||||||||||||
| Portugal | 9 920 760 | 5 143 280 | 51.84 | ||||||||||||||||
| Austria | 8 054 800 | 4 147 630 | 51.49 | ||||||||||||||||
| Italy | 57 333 000 | 29 515 580 | 51.48 | ||||||||||||||||
| Germany | 81 817 500 | 41 992 680 | 51.32 | ||||||||||||||||
| France | 58 255 880 | 29 891 710 | 51.31 | ||||||||||||||||
| Finland | 5 116 830 | 2 625 130 | 51.30 | ||||||||||||||||
| Belgium | 10 143 050 | 5 184 260 | 51.11 | ||||||||||||||||
| Spain | 39 241 930 | 20 037 940 | 51.06 | ||||||||||||||||
| United Kingdom | 58 693 970 | 29 908 290 | 50.96 | ||||||||||||||||
| Luxembourg | 412 800 | 210 200 | 50.92 | ||||||||||||||||
| Greece | 10 465 060 | 5 300 110 | 50.65 | ||||||||||||||||
| Denmark | 5 251 030 | 2 658 800 | 50.63 | ||||||||||||||||
| Sweden | 8 837 500 | 4 471 430 | 50.60 | ||||||||||||||||
| Netherlands | 15 493 890 | 7 831 600 | 50.55 | ||||||||||||||||
| Ireland | 3 615 600 | 1 820 600 | 50.3 | ||||||||||||||||
Source: Eurostat Database 1997
5. Europe also has the highest proportion of older women in the world. There are now approximately three women for every two men between the ages of 65 and 79, with more than twice as many women over the age of 80 (EIWH, 1996).
Feminization Ratio, EU 15 (1996)
Source: Eurostat Database 1997
6. It is estimated that women, on average, live more than six years longer than men. In 1999, France had the highest life expectancy at birth at 83.6 years for women, followed closely by Italy and Spain (United Nations, 2000).
Fertility and Life Expectancy Statistics
| Country | Total pop (000) | % of pop. 60+1999 | Total fertility rate | Life expectancy at birth (years) Female 1999 | Life expectancy at birth (years) Males 1999 |
||||||||||||||
| Austria | 8 177 | 19.9 | 1.4 | 80.4 | 74.4 | ||||||||||||||
| Belgium | 10 152 | 21.6 | 1.6 | 81.3 | 74.5 | ||||||||||||||
| Denmark | 5 282 | 20.0 | 1.7 | 78.1 | 72.2 | ||||||||||||||
| Finland | 5 165 | 19.7 | 1.7 | 80.7 | 73.4 | ||||||||||||||
| France | 58 886 | 20.5 | 1.7 | 83.6 | 74.9 | ||||||||||||||
| Germany | 82 178 | 22.7 | 1.3 | 80.1 | 73.7 | ||||||||||||||
| Greece | 10 626 | 23.6 | 1.3 | 80.5 | 75.5 | ||||||||||||||
| Ireland | 3 705 | 15.2 | 1.9 | 78.3 | 73.3 | ||||||||||||||
| Italy | 57 343 | 23.9 | 1.2 | 82.1 | 75.4 | ||||||||||||||
| Luxembourg | 426 | 19.4 | 1.7 | 81.4 | 74.5 | ||||||||||||||
| Netherlands | 15 735 | 18.3 | 1.5 | 81.1 | 75.0 | ||||||||||||||
| Portugal | 9 873 | 20.8 | 1.4 | 79.5 | 72.0 | ||||||||||||||
| Spain | 39 634 | 21.6 | 1.1 | 82.1 | 75.3 | ||||||||||||||
| Sweden | 8 892 | 22.3 | 1.6 | 81.9 | 77.1 | ||||||||||||||
| UK | 58 744 | 20.9 | 1.7 | 79.7 | 74.7 | ||||||||||||||
SOURCE: United Nations ( 2000 )
The World’s Women
7. The graph below illustrates the differences in life expectancy for the total population and the female population in Europe in terms of life expectancy in years at age 65.
Life Expectancy at Age 65 for Total Population and for Women within Europe
Source: WHO European Region (2000). Health For All Database.


